.
Monitoring of cabling activities during the LHC LS1
The development of a reliable monitoring system was a key element in the successful consolidation and upgrade of the cabling infrastructure of the CERN accelerator complex during the LHC first shutdown period. This paper presents the implementation and use of this monitoring system during the two year-long shutdown, focusing on improvements delivered in project management and providing practical examples of applications.
Introduction
The Large Hadron Collider (LHC) at CERN entered into its first long shutdown period (LS1) in February 2013 [1]. In this framework, the consolidation and upgrade of the cabling infrastructure of the CERN accelerator complex represented one of the most challenging projects in terms of complexity and workload [2]. The undertaking has required substantial project management effort and a significant deployment of resources, consisting of CERN staff and industrial support contractors [3]. A monitoring system has been then developed to support the project management dealing with project preparation and execution. Dedicated tools were used to measure project performance.
The goal
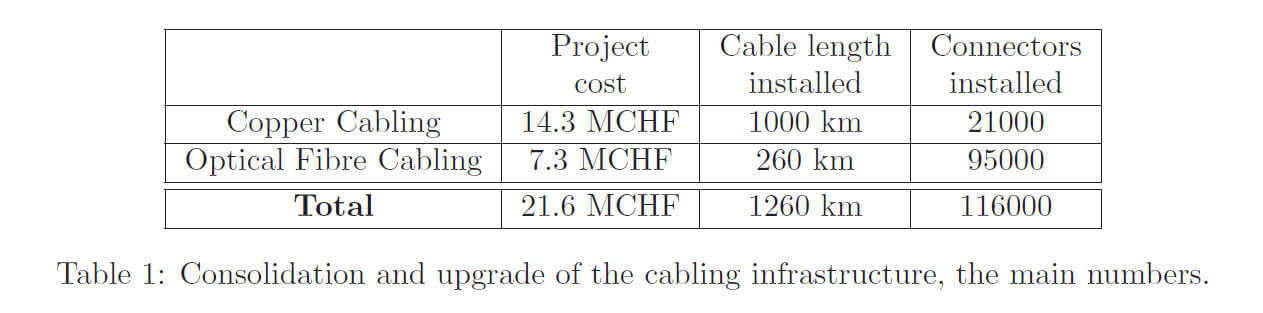
The consolidation and upgrade of the cabling infrastructure consisted of a large number of activities distributed over 350 worksites. They were carried out to a tight schedule and often in radioactive environments or as part of a coordinated activity with other CERN groups. Table 1 provides a numerical summary of the project. Performing the cabling activities in these conditions turned out to be very demanding in terms of work organization and execution, requiring anticipation of strategic actions and a fast turn-around control of project status. For this reason CERN has developed a comprehensive monitoring system, supporting the project management, to deal with all critical aspects of the project such as duration, cost, resource availability, safety (namely: radiation dose absorbed by the personeel) and installation quality. During the LS1 the monitoring system has served the dual purposes of recording project performance as well as of predicting its future evolution, warning on possible coming issues and easing the identifications of delays and the implementation of changes to the project.
The monitoring system structure
The monitoring system consisted of a set of software, tools and procedures working together with the aim of summarizing the large number of data sources in simple graphs and tables. Weekly meeting with industrial support contractors, inspections on the worksites as well as reports from activity supervisors have assured quick feedback on the six most challenging aspects of the project. Based on this input, a dedicated software system processed the information allowing comparisons of actual outcomes with the original baseline and forecasts.
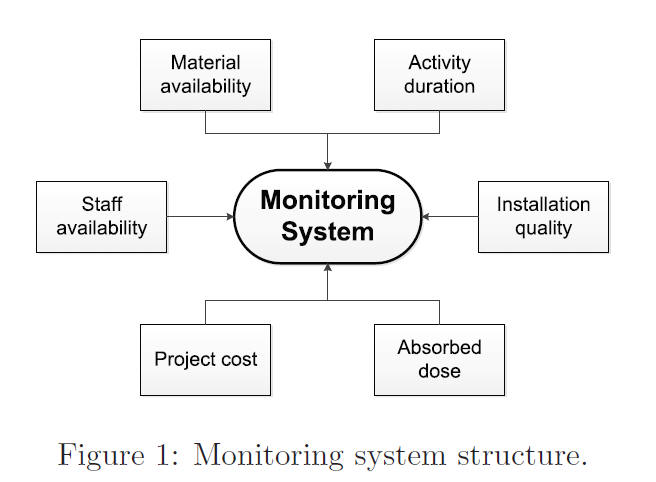
The scheme in Figure 1 shows the structure implemented with the six aspects monitored.
The activity duration was followed through an in-house software system called GESMAR, in which industrial support staff introduced on a daily basis the information for each pulled cable, connector assembly and test. They also updated the progress of the mechanical installation, the cable removal, the reworking and activity verification.
Stock availability and timely delivery of the material on the worksite were verified in parallel.
The number of CERN and industrial support contractor staff deployed on the worksite (roughly 150 people in total) was constantly monitored by using the accelerator access control systems installed on the site or through feedback from the activity supervisors.
Monitoring of the project cost was required to make sure that the project remained within the budget margin. Reports on payments to industrial contractors were provided together with forecasts of budget engagements.
The CERN safety rules demand a precise estimation and follow up of the radiation dose absorbed by workers. Daily reports alerted project manager in case the absorbed dose exceeded the estimated limit.
Finally the quality of the installation delivered to the users was verified by continuous field inspections. Warning notes were issued in case of the quality requirements were at risk of not being satisfied.
Data analysis and reporting
Automatic reports on overall project performance were extracted daily and used as indicators. Offline analysis and the cross checking of the collected data allowed detection of potential activity issues like planning delays, resources constraints or failures to comply with the approved working procedures.
The example of the PS Booster cabling activity has showed the effectiveness of the tool (see Figure2). During the cabling installation, the tool predicted that the radiation dose absorbed by the workers would exceed the safety limit, alerting management and allowing a pre-emptive adjustment to the method used.
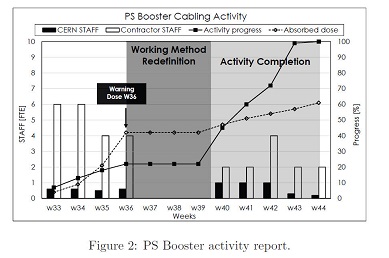
Figure 3 shows a set of graphs used to review the overall project performance.
The number of activities completed was monitored weekly in order to define the overall project completion percentage. More or less resources were assigned to the worksites in case of delay or required acceleration of the schedule, guaranteeing the respect of the deadlines and preventing a domino effect on the whole project planning. As it can be seen in Figure 3(a) the actual progress followed the original baseline all along the LS1. Only a minor delay occurred due to the addition of unforeseen activities to the planning, slowing down the overall project execution.
Figure 3(b) shows the non-conformities detected on the worksites grouped by four categories: organization (i.e. problem related to the industrial support contract internal organisational), planning (i.e. non respect of the mutually deadlines agreed), quality (i.e. problems associated to the quality of the works performed) and security (i.e. non respect of safety rules and regulations). The analysis allowed the identification, classification and definition of corrective actions for the installations, delivering improvement to the working method and bringing about significant improvements to the global quality of the installations.
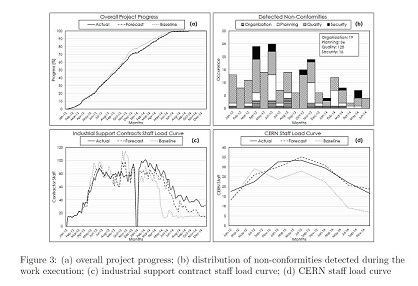
Figures 3(c) and (d) show respectively the industrial support contract and CERN staff load curve over the entire LS1 period. Forecast load curves, based on estimates of future workload, have allowed resource requirements to be set up in advance. During 2014, additional resources had been put in place to cope with unforeseen cabling activities, leading management to engage an additional industrial support contract. The load curves also addressed changes to the planning to mitigate manpower constraints. Activities were anticipated or postponed to smooth as much as possible the load curve and prevent wherever possible the presence of troublesome peaks and holes (planning "agility").
Conclusion
The implementation of a monitoring system played a fundamental role in the successful execution of the cabling activities during the LS1. About 1300 kilometers of cables, distributed in different machine areas and representing an investment of about 21.6 MCHF, have been installed respecting the schedule.
The system proved its effectiveness throughout the LS1 by assisting the project management in the definition of anticipated strategic actions and to implement changes to the project. Furthermore the tool supported the improvement of the general working method allowing the Long Shutdown 2 to be planned on a much more informed basis.
Leave a comment